
To Buy or Not to Buy? New vs Old Construction
/
Deniz Kahramaner is the Founder & CEO of the data driven Real Estate Brokerage Atlasa. His mission is to help home buyers understand the tradeoffs of different home options using big data and analytics. You can reach Deniz at deniz@atlasa.com or 650-770-3100.
Prelude
Deniz and Jeremie realized that they can help real estate buyers and sellers be more informed by utilizing existing real estate data. This blog post is a part of our data initiative.
So… New Construction
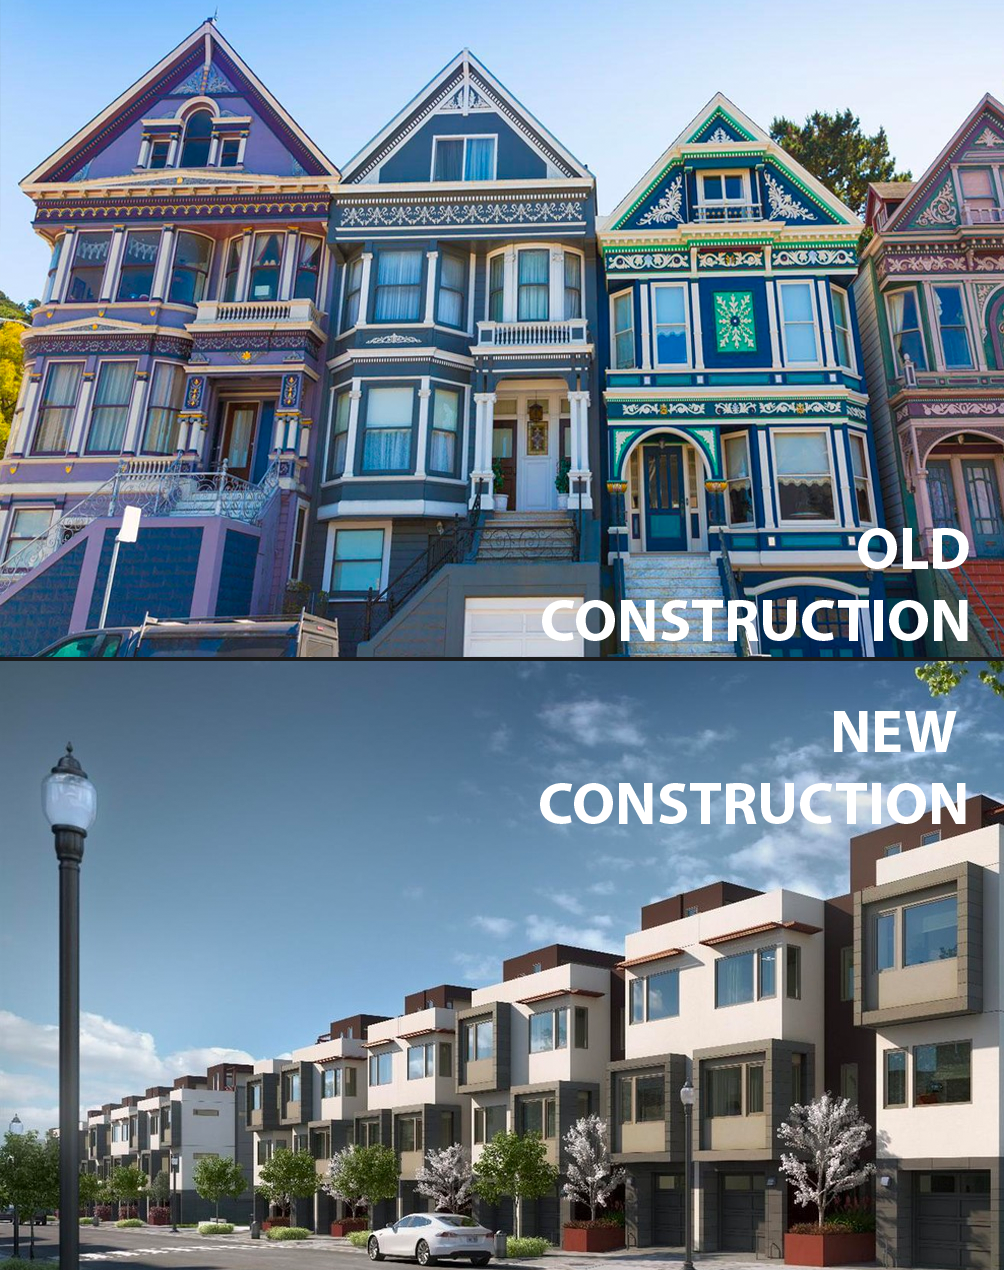
If you are looking to buy a condo in San Francisco, you have options when it comes to architecture and design. From old Victorian-style buildings to modern new construction, there are many different homes to choose from.

The first thing someone will realize when looking at condos in San Francisco is that newly built condos are $200-$300 per square foot more expensive than older condos.

Is the more expensive price tag worth it?
To explore this question further, we should answer the key question:
How does the value of a new condo hold up compared to an older one?
In order to answer the question above, we created a database of every condo sold between 2007 and 2017 from the San Francisco MLS, where construction dates vary between 1900 to 2017. We also made sure that traditionally cheaper neighborhoods like SOMA in 2008, Candlestick and the Tenderloin do not bias the data.
We grouped condos by their construction year to make the data easier to understand.
Pre-2000 Construction
What we found was fascinating: the median price per square foot (PPSF) of condos built before 2000 were all very similar and appreciated at the exact same rate, as seen below:

Median Price Per Square Foot (Median PPSF) of condos built in different date groups
This led to the following conclusion:
After 20 years, newer condos lose their price premium compared to older condos.
In the graph below, we condensed pre-2000 construction into only one line. This made it easier for us to visually compare pre-2000 construction to post-2000 construction.

Median PPSF of Buildings Built Between 1900–2000 Between 2007 and 2017
This graph shows the surprising fact that the 2008 recession didn’t cause as drastic a dip in condo prices in the San Francisco market as in other parts of the United States. Watch out for an upcoming blog post about this!
What About Condos Built After 2000?
We scrutinized condos built between 2001 and 2017 below. Some interesting findings ensued.
Condos Built Between 2001–2006
The median PPSF of both old and new developments (built between 2001–2006) showed similar appreciation through the market crash, and then rapid growth beyond 2012. The U.S. is currently experiencing one of the longest economic booms since 2011. It is already the second longest in U.S. history and is due to exceed the 10-year record of the 1990s economic boom.

2001–2006 Developments’ PPSF Compared to Pre-2000 Developments’ PPSF
This graph made it clear that condos built between 2001–2006 entirely lost their price premium over pre-2000 condos over time.
Condos Built Between 2007-2008 vs Pre-2000

2007–2008 Developments’ PPSF Compared to Pre-2000 Developments’ PPSF
We observed that buildings built between 2007–2008, when compared to those built pre-2000, appreciated slightly faster until 2015, and then their price premium reverted. This shows us that newer construction, in the eyes of buyers, matters for 10 years, and slowly stops mattering afterward.
Condos Built Between 2009–2010 vs Pre-2000

Construction between 2009–2010 follows a similar but swifter pattern: They appreciate faster than pre-2000 condos right after being built, but six years after their construction date, their price premium slowly starts decreasing.
Interestingly, some new condos built in 2009 sold for cheaper than pre-2000 condos. When we looked into this, we realized that after the recession, a lot of developers held their inventory and waited to sell until 2010–2011. In 2009, most of the new construction sold was in Candlestick Point, Inner Mission and other cheap areas.
Condos Built Post-2012 vs Pre-2000
The trend continued for condos built after 2012. The PPSF line of 2012–2017 construction appreciate in parallel to older ones, and post-2012 condos maintain their price premium.

Conclusions
New construction holds their price premium over older construction fairly well for approximately 7–8 years.
New construction starts to lose this price premium after 8–10 years. 20 years later, this premium deterministically goes down to zero.
While the price premium of new construction will eventually drop, this analysis does not take into consideration the advantages of newer buildings, such as better construction quality, better earthquake resistance, nicer interiors, no rent control, cheaper maintenance costs and no asbestos/lead problems.
Price neutralization after 10 years can be a great opportunity for buyers: If you buy a 10–20 year old condo, not only are you buying a relatively new building and getting the benefits listed above, you are paying close to no premium above older condos.
As in everything derived from data, the conclusions do not apply to every single new construction. I would not rule out new constructions from your search. Notable exceptions among many are:
Landmark buildings or luxury condos, which can have wildly different appreciation patterns (e.g. 181 Fremont or classical Victorian homes) — another analysis for another day!
Some neighborhoods barely have any new construction, such as the Marina. New constructions can hold their price premium or even appreciate faster, due to shortage of supply. A good example is 1598 Bay, a rare new development in the Marina.
Up and coming neighborhoods like SOMA was in 2011 and Dogpatch and Van Ness Corridor are now, tend to have different appreciation patterns than normal. They require additional due diligence.
What if I own a brand new condo?
If you are still in the 10 year window to sell, now could be a good time to sell and buy a larger, 10+ year condo or single family home. I’d work with a good realtor (like myself) to analyze your property to see if this makes sense. There are always multiple options when you own a property: (a) you can sell and buy, (b) you hold and buy more in the city to build a portfolio and (c) you can hold and start investing in other regions.
The data has spoken!
Authors
Deniz Kahramaner is the Founder & CEO of the data driven Real Estate Brokerage Atlasa. His mission is to help home buyers understand the tradeoffs of different home options using big data and analytics. You can reach Deniz at deniz@atlasa.com or 650-770-3100.

Jeremie Young is a Data Engineer and Operations Manager at Atlasa. He was formerly a marketer at Compass and Pacific Union.
Appendix: Methodology
Grouping the Data
To better visualize the data, we grouped different construction years into the following categories
1900–1929: Turn of the 20th Century and recovery from the 1906 Earthquake
1930–1950: The Great Depression period
1951–1978: Post-World War II economic expansion
1979–1981: Lead based paint and asbestos were banned from new construction
1982–1990: 2nd longest peacetime economic expansion
1991–2000: Longest economic expansion and the Dotcom Bubble
2001–2006: Moderate expansion ended by the Great Recession in 2007
2007–2017: Last 10 years’ developments were scrutinized more to see when price premium ends
Why Median Price Per Square Foot?
We used median price per square foot (PPSF) to compare appreciation and value growth in condos.
We used PPSF instead of sales price, because PPSF factors in the size of the condo, the biggest determinant of value.
We used median instead of the average because average values are highly skewed by very expensive outliers i.e. luxury penthouse condos that sell for $5–10M.
No Single Family Homes: We excluded single family homes in this analysis as there are very few newly built single family homes — most new construction are large condo complexes.
Exclusion of 2011: We excluded 2011 from the analysis as an anomaly as there wasn’t enough new construction that year.
Not Factoring in Renovations/Remodeling: Renovation and remodeling of older condos were not factored in the analysis, as that data is not available in a structured format and there are too many types of renovations to compare. In our experience, most of the condos on the market have been remodeled to look nice during an open house by the realtor.
Architectural Value: Building design gets old after 20 years, while some homes have timeless designs, like Victorian houses. This data is not available on the MLS, so we could not disambiguate between exterior architecture.